
Data sources
A dashboard can show two kinds of data: your workspace’s own data, which is always there, and data sources you bring in from connected apps, spreadsheets and web links. This page explains both, and how to add, refresh and manage your own sources.
Your workspace data
Section titled “Your workspace data”Every dashboard can use your workspace’s own activity without any setup. Ask Dashboard elf for it by name, for example “tasks by status” or “credits used this month by member”. It includes:
| Data | What it covers |
|---|---|
| Tasks | Tasks and breakaways you can see |
| Workflow runs | Runs of the workflows you can see: status, duration and who started them |
| AI usage | AI chat replies and tokens by model and member (counts only, never what was said) |
| Usage | Credits used, by feature, model and member |
| Chats | How many AI chats, how active and by whom (counts only) |
| Agents and Agent runs | Your agents, and how their runs went |
| Elves | Your elves, their tasks and their activity |
| Teams and Team messages | Your teams and how active they are (counts only) |
| Members | Members of the workspace and their roles (owners and admins only) |
This data is always filtered to what you may see. A member sees their own usage and the work they have access to. Owners and admins see the whole workspace.
Your own data sources
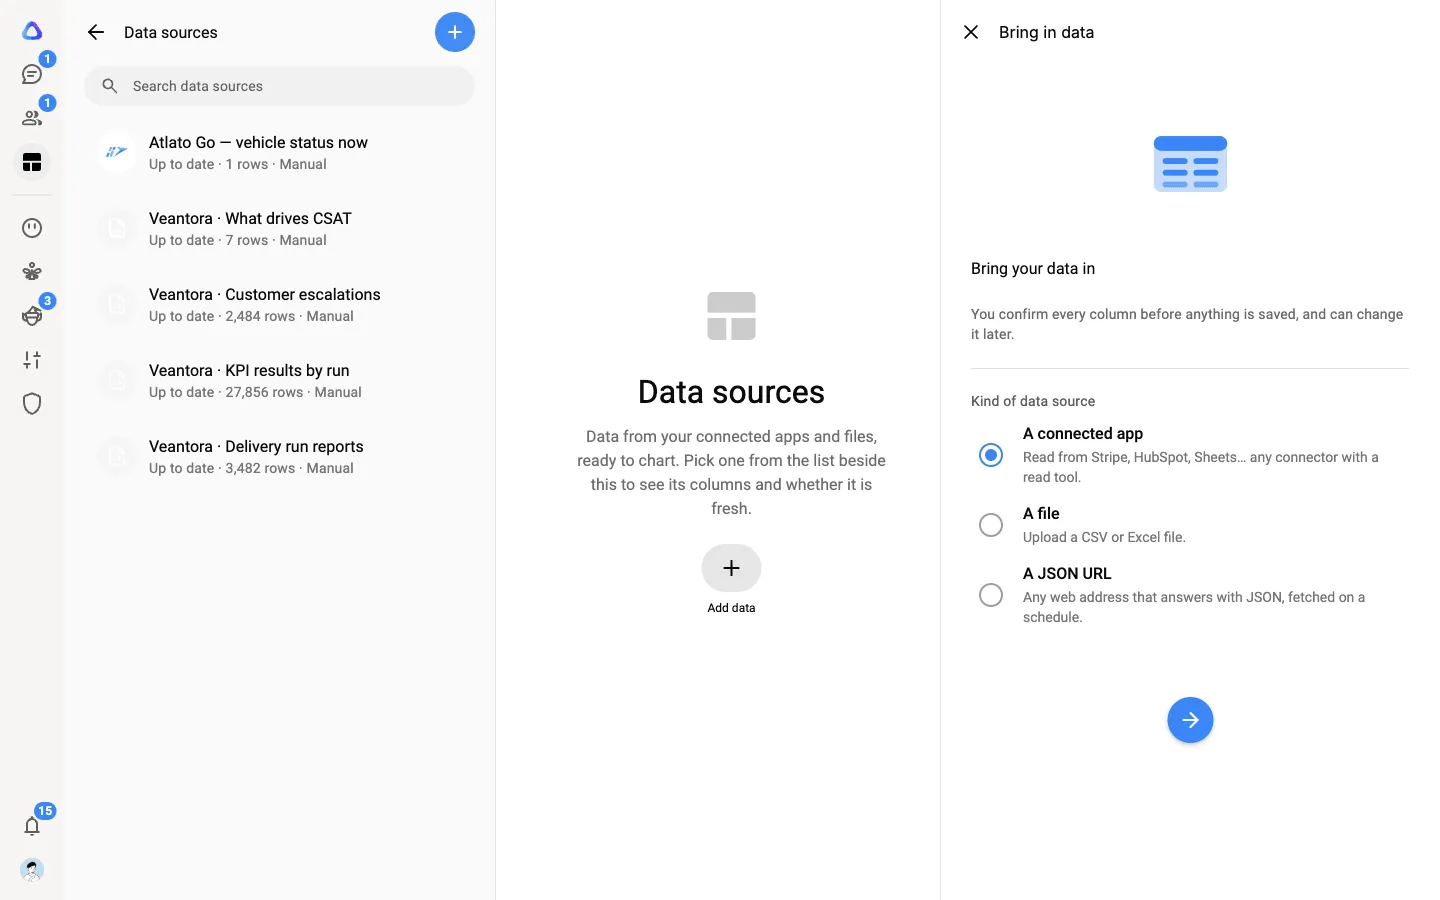
Section titled “Your own data sources”To chart data from outside the workspace, add a data source. Select Dashboards, then the Data sources button at the top of the column, then Add data. You can bring in:
| Kind | What it is | Kept up to date |
|---|---|---|
| A connected app | Read from any connected app that offers a read tool, such as Stripe, HubSpot or Google Sheets. | On a schedule you choose, or when you select Refresh |
| A file | Upload a CSV or Excel file of up to 20 MB. | When you choose a new file with Edit |
| A JSON URL | Any web address that answers with JSON data. | On a schedule you choose, or when you select Refresh |
Data sources only ever read. They never change anything in your apps.
Add data from a connected app
Section titled “Add data from a connected app”-
Make sure the app is connected first. See Connectors.
-
Select Add data, choose A connected app, then select Next.
-
Under Choose what to read, pick the app’s read tool, for example “List invoices”. Fill in any Parameters it asks for, then select Preview.
-
In Preview, pick the list your rows come from.
-
Under Columns, check each column’s name and type (Number, Date, Text, Category, Yes / no or Person), and untick any you do not need.
-
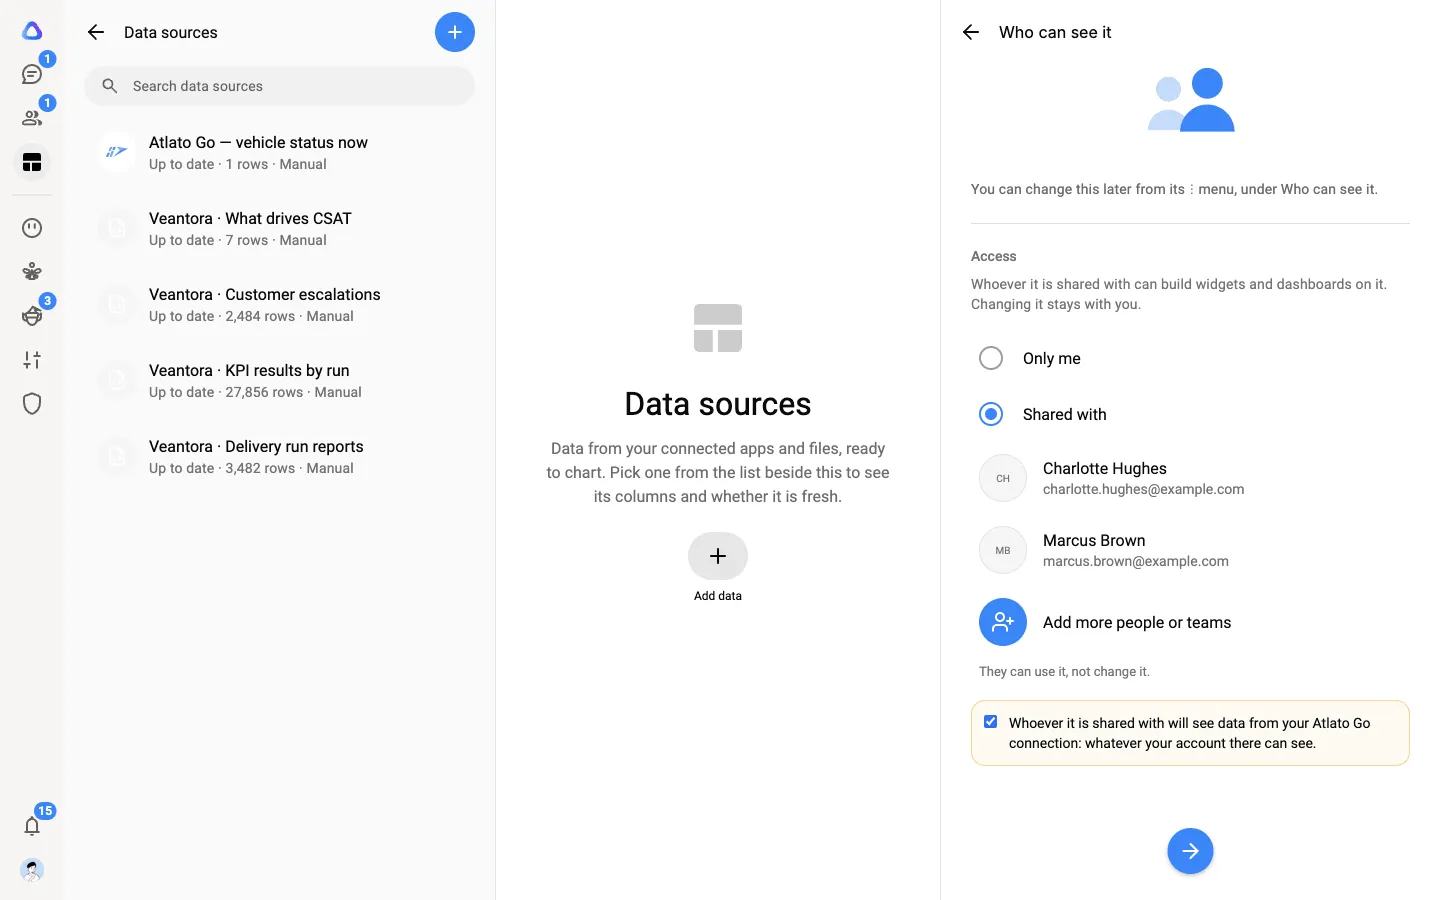
Give it a name and description, then choose Who can see it: Only me, or Shared with and select Add people or teams. Whoever you share it with can build widgets and dashboards on it, but only you can change it.
-
Choose how it refreshes:
- Replace: each refresh is the whole truth swaps the rows for what the app returns now.
- Append: keep every refresh, so history builds up keeps each refresh with its time. Use this when the app only gives today’s numbers and you want a trend over time.
Then pick How often: Only when I press Refresh, Every hour, Every 6 hours or Every day.
-
Under What AI can see, choose what Dashboard elf may see of this data. Then select Create and load.
The panel closes and the data source’s page shows Loading your data… until the rows are in, then Data loaded successfully!
Upload a spreadsheet
Section titled “Upload a spreadsheet”Choose A file, then select a CSV or Excel file (.csv, .xlsx or .xls) of up to 20 MB. The first row is read as the column names. If the workbook has several sheets, pick the one to use. Check the columns, name it, choose who can see it and what AI can see, then select Upload.
Read from a web address
Section titled “Read from a web address”Choose A JSON URL and enter the URL. If the address needs a key or password, add it under Headers. Select Preview, then continue as for a connected app.
Map it for me
Section titled “Map it for me”Sometimes an app or web address returns data that is not a ready-made table. Let an AI model find the rows for you:
-
In the Preview step, select Advanced: reshape with a transform, then Map it for me.
-
Under AI model, choose the model to use. Opened from a dashboard, this is the dashboard’s own AI model.
-
Optionally, describe what you want to chart in What do you want to chart?, for example “revenue per day, one row per invoice”. Then select Send and map.
-
Check the rows under Here is what it found. Select Use this to take them back to Preview, or Try again with a different model or description.
It sends a sample of the result to the AI model you chose, on your own provider key or subscription. Nothing is saved until you confirm the columns.
What AI can see
Section titled “What AI can see”Each data source decides how much of its data Dashboard elf may see while it builds with you. What it sees is sent to the AI model you chose.
- Aggregates (default): the AI sees field names, sample values and grouped totals, never individual rows.
- Field names only: the AI can build charts from the data but never sees a value. Only people see the numbers.
Use Field names only for anything sensitive, such as salaries or customer details.
Let Dashboard elf add sources for you
Section titled “Let Dashboard elf add sources for you”While you build a dashboard, you can simply ask for data from an app, for example “chart our open HubSpot deals by stage”. Dashboard elf finds the right read tool in your connected apps, creates the data source and builds on it. A source it made is marked Created by AI and is read-only.
It can also take figures from your files. In the Build with Elf message box, select +, then Knowledge Base, and pick up to 5 of your knowledge bases. Dashboard elf searches their files and can turn a table of figures it finds into a data source. The note it adds to the chat names the file the numbers came from, so you can check them.
Data written by a workflow
Section titled “Data written by a workflow”A workflow can write its results straight into a data source, so a dashboard shows them as soon as each run finishes. These sources are marked Workflow output. See Workflow steps.
Manage a data source
Section titled “Manage a data source”Select Dashboards → Data sources and pick a source from the list. Its page shows where the rows come from, how many there are, when it was last loaded and when it refreshes next, and its columns.
- Select Refresh to load it again now.
- The ⋮ menu offers Data source details, Edit, Settings, Who can see it, View data, History and Delete data source, depending on your access.
- Settings changes how it refreshes, what AI can see, and its columns’ names and types. Widgets built on it keep working.
- Who can see it changes who it is shared with. An older source shared with the whole workspace shows Anyone in the workspace there. That choice is no longer offered: pick Only me or Shared with to change it.
If a refresh fails, the page says Last tried and shows the reason. A common cause is a connection that was removed or has expired; reconnect the app in Connectors.