
Dashboards
Dashboards are live views of your work: tasks, workflow runs, AI usage, credits, and data from the apps you connected or the spreadsheets you upload. You describe what you want to see, and the dashboard’s AI helper builds it for you. You can also add and arrange widgets yourself.
A dashboard reads its data fresh each time you open it, and can also refresh on a timer, so the numbers stay current without anyone rebuilding it.
Before you begin
Section titled “Before you begin”- Most members can create dashboards. Some roles can only view the dashboards shared with them, and some roles hide Dashboards altogether.
- Each dashboard runs its AI on a model from your own AI provider. If you have not connected one yet, see Connect an AI model.
Find your dashboards
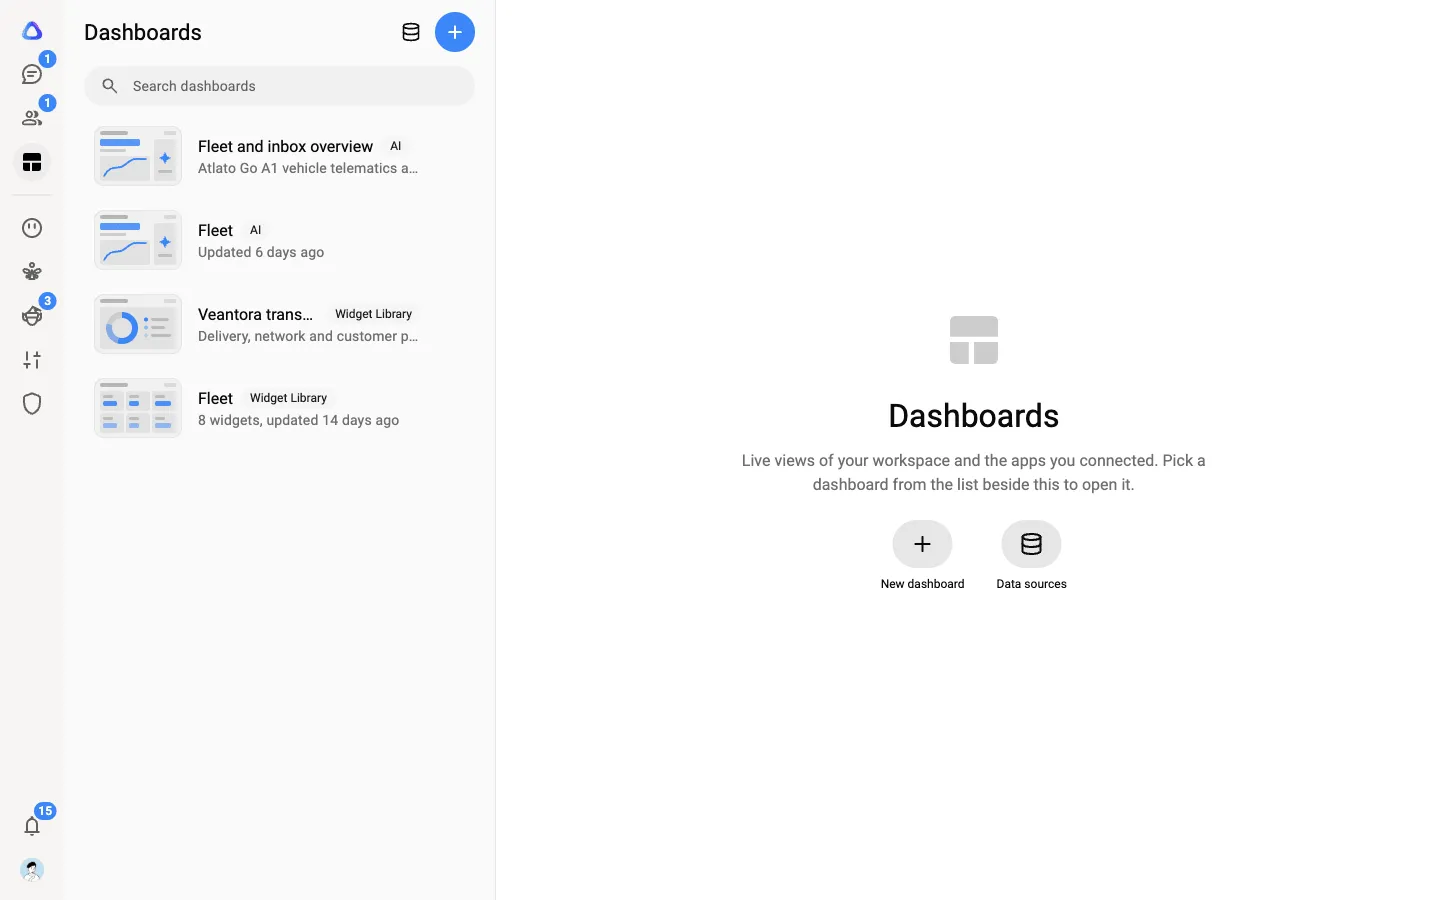
Section titled “Find your dashboards”Select Dashboards in the rail on the left. The column beside it lists every dashboard you own or that someone shared with you, each with a small preview. Use Search dashboards to find one by name.
At the top of the column you will find two buttons:
- New dashboard (the plus sign) starts a new dashboard.
- Data sources opens the data you brought in from apps, files and web links. See Data sources.
Two kinds of dashboard
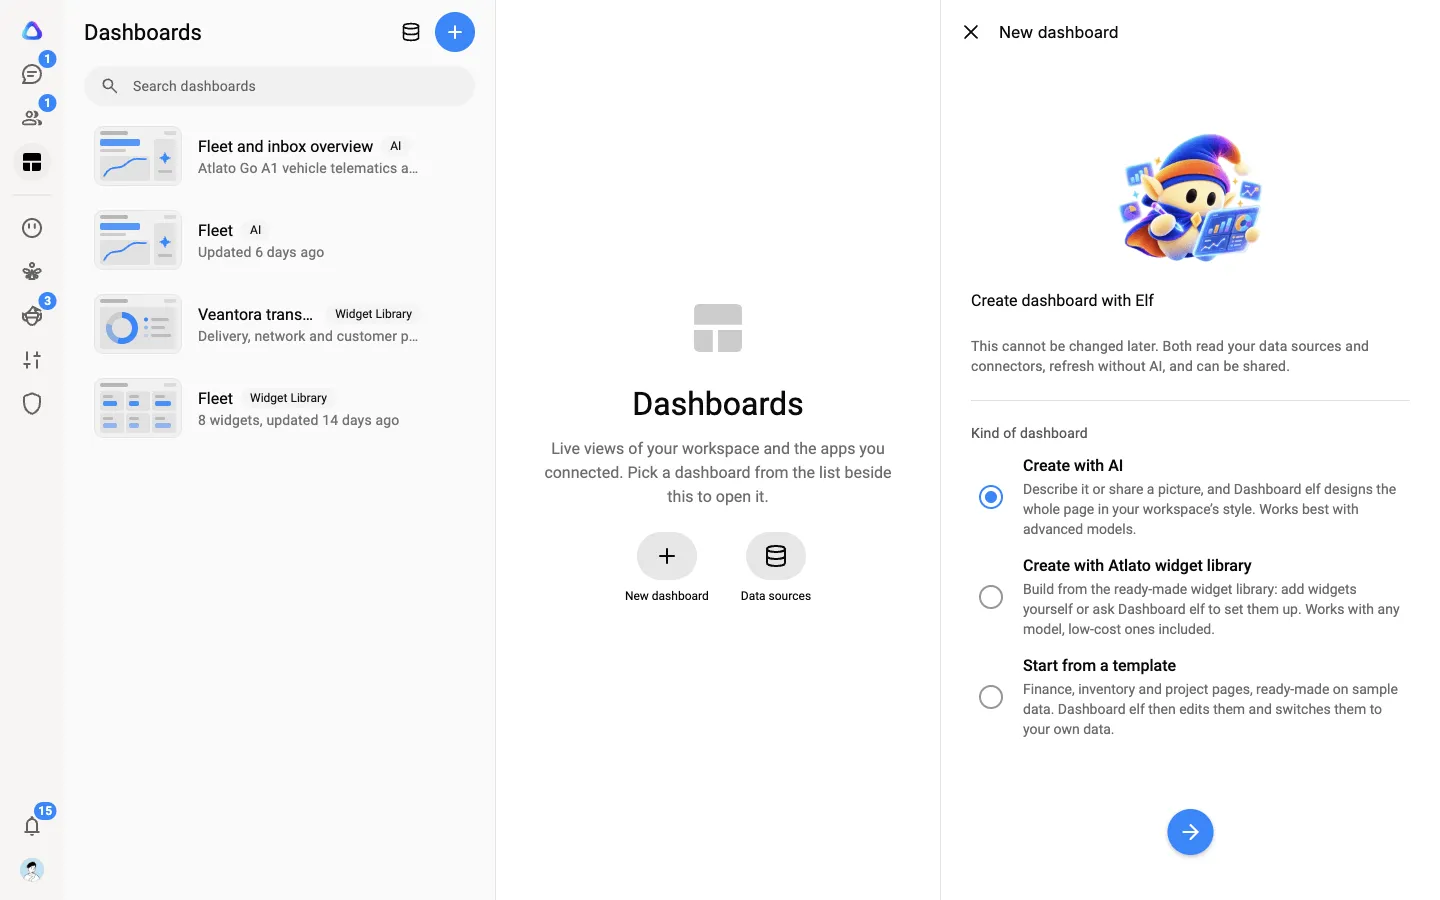
Section titled “Two kinds of dashboard”When you create a dashboard, you choose how it is made. You cannot change the kind later.
| Elf Canvas | Widget Board | |
|---|---|---|
| Shown in the list as | AI | Widget Library |
| How it is made | You describe the page, or share a picture of one you like, and the AI designs the whole page in your workspace’s style. | You build from a ready-made library of numbers, charts and insight components, by hand or with the AI’s help. |
| Best for | A polished, one-of-a-kind page | A dashboard you want to tune widget by widget |
| AI model | Works best with advanced models | Works with any model, low-cost ones included |
Both kinds read your data sources and connected apps, refresh without using the AI, and can be shared.
Meet Dashboard elf
Section titled “Meet Dashboard elf”Dashboard elf (often just Elf on screen) is the AI helper built into every dashboard. You talk to it in the Build with Elf panel: tell it what you want to see, and it finds the data, picks the right charts and lays out the page. It can also set up data sources for you from your connected apps, or from figures in the files of a knowledge base you add to your message. See Let Dashboard elf add sources for you.
Dashboard elf runs on the AI model you choose for the dashboard, using your own AI provider key or subscription. You can change the model at any time in the Build with Elf panel.
Create a dashboard
Section titled “Create a dashboard”-
Select Dashboards in the rail, then select New dashboard.
-
Choose how to start:
- Create with AI makes an Elf Canvas.
- Create with Atlato widget library makes a Widget Board.
- Start from a template opens a ready-made finance, inventory or project page on sample data. Dashboard elf can then change it and switch it to your own data.
-
If you chose a template, pick one. Use All, Finance, Inventory or Projects and tasks to narrow the list, and preview a template before you pick it.
-
Give the dashboard a name. A blank dashboard can also have a short description, which shows under its name in the list.
-
Choose who can see it: Only me, or Shared with and add people. A dashboard made from a template starts private to you. You can share it once it is open.
-
Under AI model, choose the model Dashboard elf runs on, then select Next.
The dashboard opens with the Build with Elf panel beside it. It is saved as soon as you add a widget or ask Dashboard elf to build something. If you leave before that, the empty dashboard is discarded.
What everyone sees
Section titled “What everyone sees”A dashboard only ever shows each person the data they are allowed to see. Two people can open the same shared dashboard and see different numbers, because each sees their own view of tasks, runs and usage. Workspace-wide figures, such as the member list, are for owners and admins.
Your role decides whether you can use Dashboards, and whether Dashboard elf may read data and use connected apps for you. When it may not, you see You don’t have access to this data. Contact your administrator for further access. An admin can change this in your role. See Role templates.
Change the time period and refresh
Section titled “Change the time period and refresh”At the top of every dashboard you can:
- Pick a Date range: Last 7 days, Last 30 days, Last 90 days, This month, This quarter, This year, All time, or Custom range… for your own dates.
- Set Auto-refresh: No auto-refresh, Every minute, Every 5 minutes, Every 15 minutes, or Custom interval…. Only people who can edit the dashboard can change this.
If you can edit the dashboard, the date range you pick is saved with it, so everyone sees that period. If you can only view it, your choice changes your own view only.
Credits
Section titled “Credits”Building with Dashboard elf and refreshing data sources use credits. Looking at a dashboard does not. See Credits and top-ups.